
After completing my training as a data analyst, i realized i didn’t just want to clean and analyze data, i wanted to go further. That desire led me to data science, where I could not only prepare and explore datasets, but also build smart dashboards, solve real world problems, and deliver insights through advanced tools and visualizations.
🎯 Why This Project?
I really wanted to build powerful dashboards that don’t just show data but explain it, solve real problems, and offer clear insights through every possible lens, especially through effective visualizations.
This project, analyzing and visualizing data from the Books to Scrape website wasn’t just a technical exercise. It was a learning journey. From web scraping multiple pages to cleaning the dataset, exploring patterns, and building an interactive dashboard using Streamlit, it took time, effort, and plenty of debugging. But the skills and knowledge I gained along the way were totally worth it.
Before this, I built a smaller project (like a student pass prediction), but this dashboard marks a huge step forward in both complexity and design.
“No pain, no gain.”
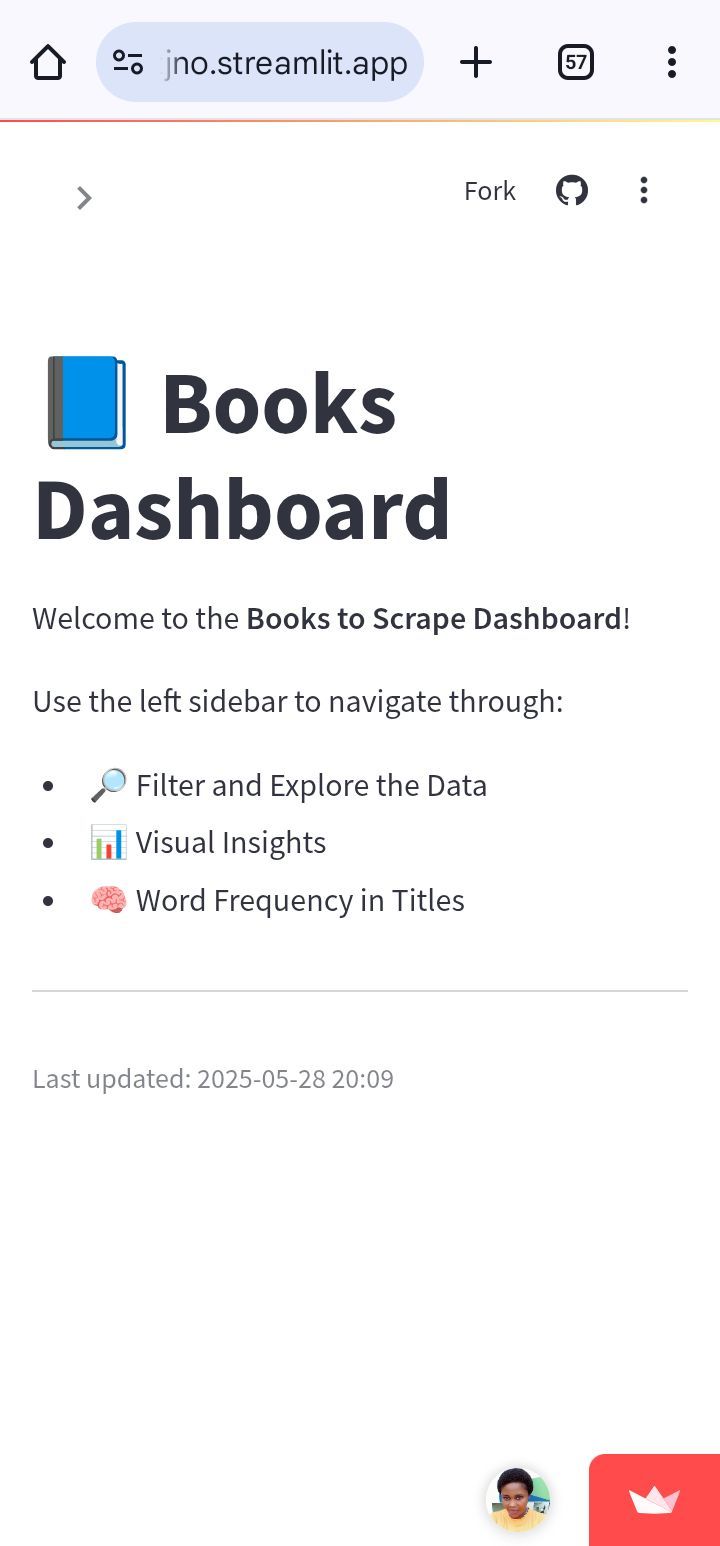
🧠 What the Dashboard Includes
- 🔍 Book filtering tools (by price, rating, availability)
- 📊 Visual charts (using Seaborn and Plotly)
- 🧠 Word frequency exploration
- 📥 CSV export options
- 💖 Interactive top 5 most expensive books chart
💼 Open to Internship Opportunities
I hope this project not only shows what I can currently do, but also highlights how far I’ve come and how much I’m ready to grow.
As someone who transitioned from data analysis into data science with a strong drive to keep learning, I’m open to internship or entry-level opportunities where I can contribute, grow, and continue building real-world skills in problem solving, dashboard creation, and beyond.
I believe the best way for me to improve is by working with experienced teams on meaningful projects. So if you’re looking for someone eager to learn, detail oriented, and ready to tackle challenges, I’d love to connect!
🔗 View the Project
🛠 View Source Code on GitHub
📊 Launch the Live Streamlit Dashboard